“[W]hen it comes to disentangling natural variability from anthropogenically affected variability the vast majority of the instrumental record may be biased.” — Büntgen et al., 2017
.
.
Yes, some regions of the Earth have been warming in recent decades or at some point in the last 100 years. Some regions have been cooling for decades at a time. And many regions have shown no significant net changes or trends in either direction relative to the last few hundred to thousands of years.
.
Succinctly, then, scientists publishing in peer-reviewed journals have increasingly affirmed that there is nothing historically unprecedented or remarkable about today’s climate when viewed in the context of long-term natural variability.

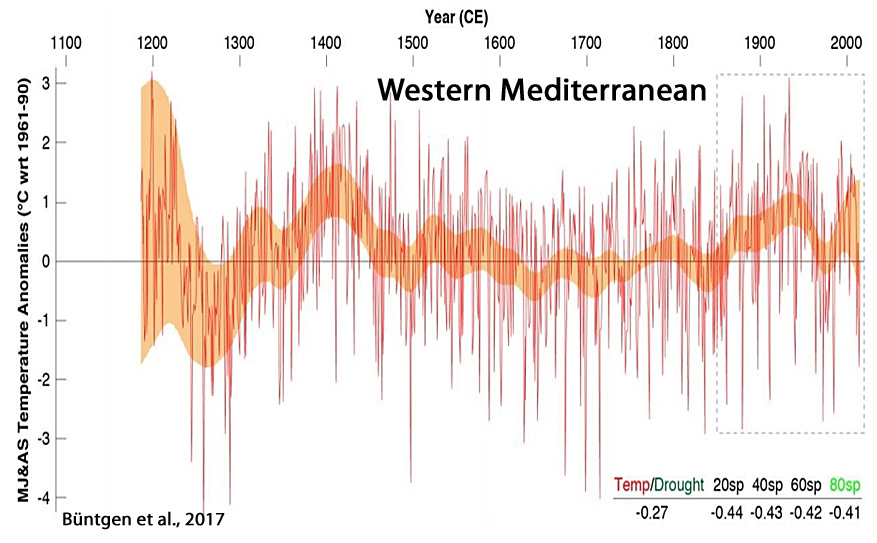
“Spanning the period 1186-2014 CE, the new reconstruction reveals overall warmer conditions around 1200 and 1400, and again after ~1850. … Little agreement is found with climate model simulations that consistently overestimate recent summer warming and underestimate pre-industrial temperature changes. … [W]hen it comes to disentangling natural variability from anthropogenically affected variability the vast majority of the instrumental record may be biased. …


“The transition from warm to colder climatic conditions occurs around 1300 CE associated with the Wolf solar minimum. The coldest SSTs are detected between 1350 and 1850 CE, on Iberia during the well-known Little Ice Age (LIA) (Bradley and Jones, 1993), with the most intense cooling episodes related with other solar minima events, and major volcanic forcing and separated by intervals of relative warmth (e.g. (Crowley and Unterman, 2013; Solanki et al., 2004; Steinhilber et al., 2012; Turner et al., 2016; Usoskin et al., 2011). During the 20th century, the southern records show unusually large decadal scale SST oscillations in the context of the last 2 millennia, in particular after the mid 1970’s, within the Great Solar Maximum (1940 – 2000 (Usoskin et al., 2011)) and the “greater salinity anomaly” event in the northern Atlantic (Dickson et al., 1988), or yet the higher global temperatures of the last 1.4 ky detected by (Ahmed et al., 2013).”


“The results indicate that the climate of the Medieval Climate Anomaly (MCA, AD 900–1300) was similar to that of the Current Warm Period (CWP, AD 1850–present) … As for the Little Ice Age (LIA, AD 1550–1850), the results from this study, together with previous data from the Makassar Strait, indicate a cold and wet period compared with the CWP and the MCA in the western Pacific. The cold LIA period agrees with the timing of the Maunder sunspot minimum and is therefore associated with low solar activity.”

“A good agreement exists between the decadal cycles of LOD [length of day], MSL [mean sea level], climate and solar indices whose periods are between 12-13, 14-16, 16-18 and 28-33 years.”

“Reconstructed SSTs significantly warmed 1.1°C … from 1660s to 1800 (rate of change: 0.008°C/year), followed by a significant cooling of 0.8°C … until 1840 (rate of change: 0.02°C/year), then a significant warming of 0.8°C from 1860 until the end of reconstruction in 2007 (rate of change: 0.005°C/year).” [The amplitude of sea surface temperature warming and cooling was higher and more rapid from the 1660s to 1800 than from 1860-2007.]
‘In fact, the SST reconstruction significantly co-varied with a reconstruction of solar irradiance [Lean, 2000] on the 11-year periodicity only from ~1745 to 1825. In addition, the reconstructed SSTs were cool during the period of lower than usual solar irradiance called the Maunder minimum (1645–1715) but then warmed and cooled during the Dalton minimum (1795–1830), a second period of reduced solar irradiance. … The Dalton solar minimum and increased volcanic activity in the early 1800s could explain the decreasing SSTs from 1800 to 1850.”

“A recent effort to characterize Antarctic and sub-Antarctic climate variability during the last 200 years also concluded that most of the trends observed since satellite climate monitoring began in 1979 CE cannot yet be distinguished from natural (unforced) climate variability (Jones et al., 2016), and are of the opposite sign [cooling, not warming] to those produced by most forced climate model simulations over the same post-1979 CE interval. … (1) Temperatures over the Antarctic continent show an overall cooling trend during the period from 0 to 1900CE, which appears strongest in West Antarctica, and (2) no continent-scale warming of Antarctic temperature is evident in the last century.”


“GST [ground surface temperature] and SHF [surface heat flux] histories differ substantially in shape and chronology. Heat flux changes ahead temperature changes by 500–1000 years.”


“The main driving forces behind the Holocene climatic changes in the LYR [Lower Yangtze Region, East China] area are likely summer solar insolation associated with tropical or subtropical macro-scale climatic circulations such as the Intertropical Convergence Zone (ITCZ), Western Pacific Subtropical High (WPSH), and El Niño/Southern Oscillation (ENSO).”


“[T]he recent summer-time warming in Scotland is likely not unique when compared to multi-decadal warm periods observed in the 1300s, 1500s, and 1730s“


“Here we review proxy records of intermediate water temperatures from sediment cores and corals in the equatorial Pacific and northeastern Atlantic Oceans, spanning 10,000 years beyond the instrumental record. These records suggests that intermediate waters [0-700 m] were 1.5-2°C warmer during the Holocene Thermal Maximum than in the last century. Intermediate water masses cooled by 0.9°C from the Medieval Climate Anomaly to the Little Ice Age. These changes are significantly larger than the temperature anomalies documented in the instrumental record. The implied large perturbations in OHC and Earth’s energy budget are at odds with very small radiative forcing anomalies throughout the Holocene and Common Era. … The records suggest that dynamic processes provide an efficient mechanism to amplify small changes in insolation [surface solar radiation] into relatively large changes in OHC.”


“We suggest that solar activity may play a key role in driving the climatic fluctuations in NC [North China] during the last 22 centuries, with its quasi ∼100, 50, 23, or 22-year periodicity clearly identified in our climatic reconstructions. … It has been widely suggested from both climate modeling and observation data that solar activity plays a key role in driving late Holocene climatic fluctuations by triggering global temperature variability and atmospheric dynamical circulation“


“Our sortable-silt time series show prominent multi-decadal to multi-centennial variability, but no clear long-term trend over the past 4200 years. … [O]ur findings indicate that variations in the strength of the main branch of the Atlantic Inflow may not necessarily translate into proportional changes in northward oceanic heat transport in the eastern Nordic Seas.”


“2003– 2009 was the warmest period in the reconstruction. 1970– 2000 was colder than the last stage of the Little Ice Age (LIA).”

“The reconstruction is punctuated by a temperature increase during the 20th century; yet extreme cold and warm events during the 19th century seem to eclipse conditions during the 20th century. We found significant correlations between our March–April spring temperature reconstruction and existing gridded spring temperature reconstructions for Europe over Turkey and southeastern Europe. … During the last 200 years, our reconstruction suggests that the coldest year was 1898 and the warmest year was 1873. The reconstructed extreme events also coincided with accounts from historical records. … Further, the warming trends seen in our record agrees with data presented by Turkes and Sumer (2004), of which they attributed [20th century warming] to increased urbanization in Turkey.”


“The early part of the reconstruction (1733–1850) coincides with the end of the Little Ice Age, and exhibits 3 of the 4 coolest decadal excursions in the record. However, the mean SST estimate from that interval during the LIA is not significantly different from the late 20th Century SST mean. The most prominent cooling event in the 20th Century is a decade centered around 1965. This corresponds to a basin-wide cooling in the North Atlantic and cool phase of the AMO.”

“Through several idealized and real proxy experiments we assess the spatial and temporal extent to which isotope records can reconstruct surface temperature, 500 hPa geopotential height, and precipitation. We find local reconstruction skill to be most robust across the reconstructions, particularly for temperature and geopotential height, as well as limited non-local skill in the tropics. These results are in agreement with long-held views that isotopes in ice cores have clear value as local climate proxies, particularly for temperature and atmospheric circulation.”


“The chironomid-based record from Heihai Lake shows a summer temperature fluctuation within 2.4°C in the last c. 5000 years from the south-east margin of the QTP [Qinghai–Tibetan Plateau]. … The summer temperature changes in this region respond primarily to the variation in the Asian Summer Monsoon. The variability of solar activity is likely an important driver of summer temperatures, either directly or by modifying the strength and intensity of the Indian Ocean Summer Monsoon. … We observed a relatively long-lasting summer cooling episode (c. 0.8°C lower than the 5000-year average) between c. 270 cal. BP and AD c. 1956. … The record shows cooling episodes occurred at c. 3100, 2600, 2100 and 1600 cal. BP. This is likely related to the period defined as the Northern Hemisphere Little Ice Age (LIA; c. AD 1350–1850, equivalent to 600–100 cal. BP). These possibly relate to the 500-year quasi-periodic solar cycle. Cooling stages between c. 270 and 100 cal. BP were also recorded and these are possibly linked to the LIA suggesting a hemisphere-wide forcing mechanism for this event.”


“Growing paleoclimatic evidence suggests that the climatic signals of Medieval Warm Period and the Little Ice Age events can be detected around the world (Mayewski et al., 2004; Bertler et al., 2011). … [T]he causes for these events are still debated between changes in solar output, increased volcanic activity, shifts in zonal wind distribution, and changes in the meridional overturning circulation (Crowley, 2000; Hunt, 2006).”

“[S]ummer temperature variability at the QTP [Qinghai-Tibetan Plateau] responds rapidly to solar irradiance changes in the late Holocene”


“Overall, the strong linkage between solar variability and summer SSTs is not only of regional significance, but is also consistent over the entire North Atlantic region.”


“The last ca. 1000 years recorded the warmest SST averaging 28.5°C. We record, for the first time in this region, a cool interval, ca. 1000 years in duration, centered on 5000 cal years BP concomitant with a wet period recorded in Borneo. The record also reflects a warm interval from ca. 1000 to 500 cal years BP that may represent the Medieval Climate Anomaly. Variations in the East Asian Monsoon (EAM) and solar activity are considered as potential drivers of SST trends. However, hydrology changes related to the El Nino-Southern Oscillation (ENSO) variability, ~ shifts of the Western Pacific Warm Pool and migration of the Intertropical Convergence Zone are more likely to have impacted our SST temporal trend. … The SA [solar activity] trends (Steinhilber et al., 2012) are in general agreement with the regional cooling of SST (Linsley et al., 2010) and the SA [solar activity] oscillations are roughly coincident with the major excursions in our SST data.”

“Representing one of the strongest global climate instabilities during the Holocene, the Little Ice Age (LIA) is marked by a multicentennial-long cooling (14-19th centuries AD) that preceded the recent ‘global warming’ of the 20th century. The cooling has been predominantly attributed to reduced solar activity and was particularly pronounced during the 1645-1715 AD and 1790-1830 AD solar minima, which are known as Maunder and Dalton Minima, respectively.”


“The SST [sea surface temperature] shows a broad maximum (~17.3 °C) in the mid-Holocene (5-7 cal kyr BP), which corresponds to the Jomon transgression. … The SST maximum continued for only a century and then the SST [sea surface temperatures] dropped by 3.5 °C [15.1 to 11.6 °C] within two centuries. Several peaks fluctuate by 2°C over a few centuries.”


“Our findings are generally consistent with other records from the ISM [Indian Summer Monsoon] region, and suggest that the monsoon intensity is primarily controlled by solar irradiance on a centennial time scale. This external forcing may have been amplified by cooling events in the North Atlantic and by ENSO activity in the eastern tropical Pacific, which shifted the ITCZ further southwards.”

“The existence of depressed MAAT [mean annual temperatures] (1.3°C lower than the 3200-year average) between 1480 CE and 1860 CE (470–90 cal. yr BP) may reflect the manifestation of the ‘Little Ice Age’ (LIA) in southern Costa Rica. Evidence of low-latitude cooling and drought during the ‘LIA’ has been documented at several sites in the circum-Caribbean and from the tropical Andes, where ice cores suggest marked cooling between 1400 CE and 1900 CE. Lake and marine records recovered from study sites in the southern hemisphere also indicate the occurrence of ‘LIA’ cooling. High atmospheric aerosol concentrations, resulting from several large volcanic eruptions and sea-ice/ocean feedbacks, have been implicated as the drivers responsible for the ‘LIA’.”

“Late Holocene climate change in coastal East Asia was likely driven by ENSO variation. Our tree pollen index of warmness (TPIW) shows important late Holocene cold events associated with low sunspot periods such as Oort, Wolf, Spörer, and Maunder Minimum. Comparisons among standard Z-scores of filtered TPIW, ΔTSI, and other paleoclimate records from central and northeastern China, off the coast of northern Japan, southern Philippines, and Peru all demonstrate significant relationships [between solar activity and climate]. This suggests that solar activity drove Holocene variations in both East Asian Monsoon (EAM) and El Niño Southern Oscillation (ENSO).”


“The application of transfer functions resulted in reconstructed T July fluctuations of approximately 3 °C over the last 2800 years. Low temperatures (11.0-12.0 °C) were reconstructed for the periods between ca 1700 and 1500 cal yr BP (corresponding to the Kofun cold stage) and between ca 1200 and 150 cal yr BP (partly corresponding to the Little Ice Age [LIA]). Warm periods (modern T[emperatures] July or higher) were reconstructed for the periods between ca 2700 and 1800 cal yr BP, 1500 and 1300 cal yr BP and after 150 cal yr BP.”


“[P]roxy-inferred annual MATs[annual mean air temperatures] show the lowest value at 11,510 yr BP (7.6°C). Subsequently, temperatures rise to 10.7°C at 9540 yr BP followed by an overall decline of about 2.5°C until present (8.3°C).”

“Contrary to the often-documented warming trend over the past few centuries, but consistent with temperature record from the northern Tibetan Plateau, our data show a gradual decreasing trend of 0.3 °C in mean annual air temperature from 1750 to 1970 CE. This result suggests a gradual cooling trend in some high altitude regions over this interval, which could provide a new explanation for the observed decreasing Asian summer monsoon. In addition, our data indicate an abruptly increased interannual-to decadal-scale temperature variations of 0.8 – 2.2 °C after 1970 CE, in terms of both magnitude and frequency, indicating that the climate system in high altitude regions would become more unstable under current global warming.”


“The Holocene Thermal Maximum (HTM) was a relatively warm period that is commonly associated with the orbitally forced Holocene maximum summer insolation (e.g., Berger, 1978; Bartlein et al., 2011). Its timing varies widely from region to region but is generally detected in paleorecords between 11 and 5 cal ka BP (e.g., Kaufman et al., 2004; Bartlein et al., 2011; Renssen et al., 2012). … In Kamchatka, the timing of the HTM varies. Dirksen et al. (2013) find warmer-than-present conditions between 9000 and 5000 cal yr BP in central Kamchatka and between 7000 and 5800 cal yr BP at coastal sites.”
“Conclusion: Using a multi-proxy approach, we studied the dynamics of thermokarst characteristics in western Latvia, where thermokarst occurred exceptionally late at the Holocene Thermal Maximum. … [A] thermokarst active phase … began 8500 cal. yr BP and lasted at least until 7400 cal. yr BP. Given that thermokarst arise when the mean summer air temperature gradually increased ca. 2°C beyond the modern day temperature, we can argue that before that point, the local geomorphological conditions at the study site must have been exceptional to secure ice-block from the surficial landscape transformation and environmental processes.”
“During the Middle Holocene we detect important climatic events. From 7000 to 6800 [years before present] (MIR 23 and MIR22), we register climatic characteristics that could be related to the end of the African Humid Period, namely an increase in temperatures and a progressive reduction in arboreal cover as a result of a decrease in precipitation. The temperatures exceeded current levels by 1°C, especially in MIR23, where the most highly represented taxon is a thermo-Mediterranean species, M. (T.) duodecimcostatus.”
“The small increase in global average temperature observed over the last 166 years is the random variation of a centrally biased random walk. It is a red noise fluctuation. It is not significant, it is not a trend and it is not likely to continue.”
“Reconstructions for southern Norway based on pollen and chironomids suggest that summer temperatures were up to 2 °C higher than present in the period between 8000 and 4000 BP, when solar insolation was higher (Nesje and Dahl, 1991; Bjune et al., 2005; Velle et al., 2005a).”
Source : http://notrickszone.com/2017/05/29/80-graphs-from-58-new-2017-papers-invalidate-claims-of-unprecedented-global-scale-modern-warming/#sthash.FEd6yHCQ.vOssWCXj.dpuf
via Graphiques scientifiques, réchauffement climatique anthropique

